Measure every token,
every dollar,
every request.
Stop runaway AI costs. ModelMeter is a provider-agnostic observability platform offering granular cost attribution, dynamic budget-aware routing, and revenue correlation.
The FinOps Moat
Beyond simple tracing. Connect AI expenditure to business metrics with zero friction.
Zero-Code Telemetry
eBPF Network Sensors intercept outbound LLM API traffic autonomously.
Spend & Budget Management
Enforce budgets per team. Get real-time alerts and automatically halt requests.
Advanced Forecasting
Predict consumption with baseline trend extrapolation and burn-down amortization.
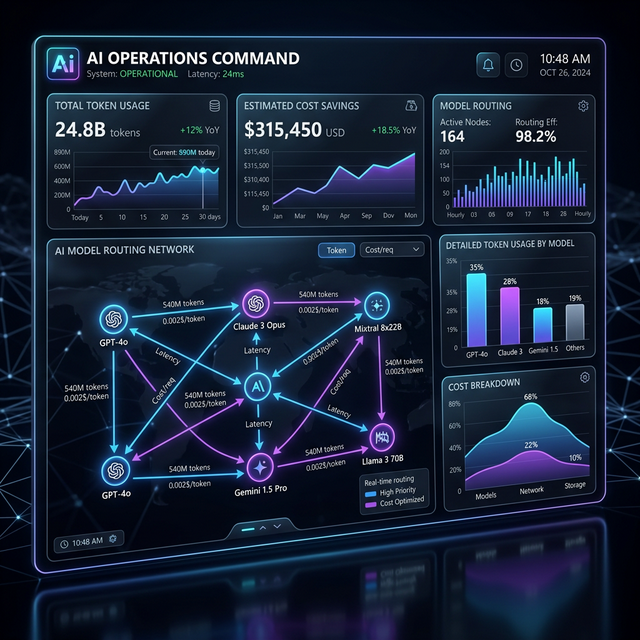
Cost-Aware Semantic Routing
Our AI Gateway dynamically evaluates prompt complexity and remaining budget.
- ✓ Dynamic Fallback: Route simple queries to cheaper models.
- ✓ Active Money Saving: Actively reduces your bills in real-time.
- ✓ Universal Adapter: Normalized telemetry across top providers.
Elevate Your Bottom Line
Connect AI token spend directly to revenue and track enterprise ESG impact.
Business ROI Tracking
Pass session IDs and track conversion value. Does this AI feature generate more revenue than it costs?
ESG & Carbon Footprint
Calculate estimated energy consumption and carbon emissions for corporate sustainability reporting.
Platform Design
A comprehensive breakdown of the core components defining our unified LLM gateway.
Product Overview
ModelMeter is built to solve runaway costs for companies using AI at scale. Our platform's core purpose is to provide an agnostic AI FinOps and observability layer that stops uncontrolled spending.
- Problem: Lack of visibility into AI API usage leading to massive unexpected bills and hard-to-track ROI.
- Solution: A zero-friction telemetry layer that measures every token, correlating it strictly to financial operations without requiring deep code changes.
Target Users
Our platform caters specifically to key stakeholders overseeing the AI ecosystem:
- 🧑💻 AI Platform Teams: Centralized latency, error rates, and model health.
- 📈 Engineering Leaders: VP/Directors tracking system limits and infrastructural efficiency.
- 💰 Finance Teams: Chargebacks, accurate cost allocation, and enterprise commit tracking.
- 🎯 Product Managers: Engagement stats, feature unit economics, and ROI connectivity.
- 🏢 CTO / CIO Level: High-level total AI spend, estimated carbon footprint, and forecasts.
Core Features
AI Usage Monitoring
- Number of requests per model
- Tokens used per request
- Latency & performance metrics
Cost Tracking
- Cost per provider & model
- Cost per team/user/app
Budget Management
- Monthly AI budget per team
- Threshold violation alerts
- Cost anomaly detection
Forecasting Engine
- Predict next month's cost
- Forecast traffic growth by X%
- Project daily token volume
Quality Monitoring
- Response quality score
- Hallucination rate
- Toxicity score
- User satisfaction feedback
Data Collection Architecture
ModelMeter utilizes a robust ingestion layer designed to operate entirely transparently to the target AI application:
- API Gateway / LLM Proxy: Intercepts requests for active management and fallback routing.
- Middleware Logging Layer: Seamless hooks inside Node.js/Python clients.
- Telemetry Pipeline: Collects OS-level packet drops and usage metrics autonomously.
- Event Streaming System: Utilizes Apache Kafka as a broker for async, low-latency logging without blocking app queries.
Data Model Schemas
Optimized relational and time-series schemas to store critical tracking info:
AI Requests: id, tenant_id, application_id, session_id, model_id, timestamp, latency_ms
User Activity: user_id, session_id, conversion_value, feature_used, event_type
Cost Metrics: cost_id, request_id, calculated_cost, currency, provider_rate
Token Usage: request_id, prompt_tokens, completion_tokens, stream_bool
Quality Metrics: score_id, request_id, hallucination_rate, toxicity_score
Feedback Scores: feedback_id, request_id, user_satisfaction_rating
Forecasting Models
Advanced predictive algorithms power the FinOps engine:
- Time Series Forecasting: Predicting seasonal usage patterns (e.g. weekday spikes vs weekend dips).
- Regression Models: Correlating business metrics (like active users) with AI requests.
- Trend Extrapolation: Estimating usage curves using Moving Averages.
Cost Prediction Formula:
Forecasted Cost = (Daily Avg Tokens * Expected Growth Rate) * Model Base Rate
Monthly Requests = (Current MTD Requests / Days Elapsed) * Days in Month
Dashboard Design
Executive Dashboard
- Total AI spend
- Forecasted cost
- Budget utilization
Engineering Dashboard
- Request latency (P95, P99)
- Model performance
- Error & failure rates
Finance Dashboard
- Cost per department
- Monthly spending trends
- Provider margin comparison
Alerts and Automation
Proactive defensive mechanisms to halt unexpected billing loops:
- 🚨 Cost Spike Alerts: Immediate notifications if OpenAI or Anthropic spend leaps unexpectedly within a small time window.
- ⚠️ Budget Thresholds: Real-time Slack/Email alerts at 50%, 80%, and 100% capacity.
- 🕵️ Abnormal Token Usage: Identifies loops or malicious prompt-injections draining tokens. Automatic hard-capping blocks the request at the gateway.
Multi-Tenant SaaS Architecture
Built for the modern enterprise, integrating strict compliance and security practices:
- Tenant Isolation: Data rows securely partitioned via `tenant_id` using Row Level Security (RLS) in the PostgreSQL warehouse.
- Role-Based Access (RBAC): Tailored UI views limiting FinOps tools to finance managers, and raw log visibility strictly to developers.
- Secure Data Separation: Allows enterprises to drop `prompt_text` at the edge to comply with strict GDPR and HIPAA regulations.
Quality vs. Efficiency Metrics
To accurately measure value, token count must be evaluated against usefulness. A true FinOps platform measures Value generated per token.
1. Response Quality Score
Evaluates Relevance, Accuracy, Completeness, and Clarity.
Quality = (R + A + C + C) / 4
2. Token Efficiency Metric
Measures how efficiently tokens produce output. Lower scores indicate verbosity.
Efficiency = Quality Score / Total Tokens
3. Satisfaction & Success
Tracks actual user feedback and task completion (e.g. thumb ratings).
Success Rate = Successful / Total Requests
4. Cost per Useful Response
Links token cost directly with actual value delivered. Critical for AI cost control.
Cost/Useful = Total Cost / Successful
5. Hallucination Rate
Detects incorrect or fabricated information.
Rate = Hallucinations / Total Responses
6. Conciseness Ratio
Detects unnecessarily long responses.
Ratio = Useful Tokens / Total Tokens
Production Quality Dashboard
| Metric | Purpose |
|---|---|
| Quality Score | Response usefulness |
| Token Usage | Cost driver |
| Token Efficiency | Quality per token |
| Satisfaction Rate | User feedback |
| Task Success Rate | Workflow completion |
| Hallucination Rate | Reliability |
High-Level Architecture
How ModelMeter seamlessly integrates with your existing AI stack.
Built For The Modern Enterprise
Finance & FinOps
Track chargebacks, enforce budgets across the organization.
Product Managers
Analyze feature-level unit economics and ROI.
Engineering Leaders
Insights into usage patterns, error rates, and latency.
Executive Suite
Review high-level executive dashboards on AI spend.
Honest Limitations
We believe in ultimate transparency. Here are the current edge cases we are actively working on.
Streaming Token Discrepancies
Streaming responses hide exact token counts from the network layer. We use localized
tokenizers (like tiktoken) as a fallback estimator.
Multi-modal Pricing
Currently, handling cost algorithms for vision and audio models is complex as their pricing models differ drastically from standard text token consumption.
Gateway Latency
While our eBPF sensors have zero-latency, using the Cost-Aware Semantic Router adds minor gateway evaluation latency (~10-15ms).
Get In Touch
Have questions? Want to contribute? We'd love to hear from you.